|
ATB PC QC Quality
Control Program
The ATB Quality
Control program has been used for 18 years all over the
world.
Here are the specifications of
the new version:
-The program works with the
soundcard of the PC.
-Setting of the definition
without script, there is no need of learning to program.
-Reference curve is measured in
the comfortable ATB PC Program.
-Tolerance field is easy to set
automatically or with the mouse.
-Rub&Buss is tested with the
signal 13 to get a nonlinear distortion measurement.
-Surrounded noise does not
disturb the Rub&Buss measurement because of the Q-Index
calculation.
The QC program is for the speaker
industry for an automatic quality test.
It is also for the automotive industry to test mounting
of the speakers for undisturbed music reproduction.
The test systems consist of the ATB QC program, the PC
with a soundcard and a test box with a power amplifier
for the connection of the speaker.
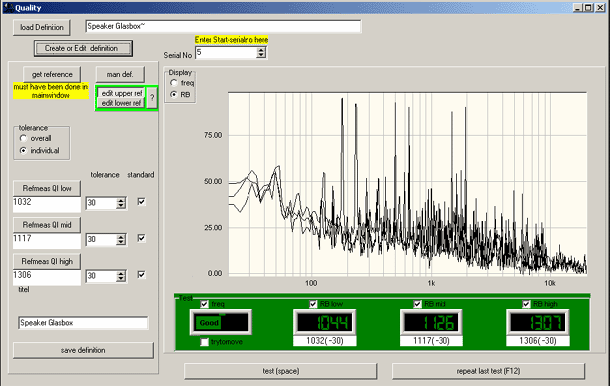
There are several measurements in the test cycle. For
the automatically passed or failed decision, each
measurement has its own tolerance mask.
One test cycle can include up to four measurements.
These are the acoustic or electrical frequency response
and three Rub&Buss measurements for woofer, mid and
tweeter.
The frequency response is tested with the M-PN stimulus.
For the automatical and manual setting of the tolerance
mask there is no need of an uncomfortable script.
The Rub&Buss measurement tests the distortion and noise
of the speaker. The stimulus for measurement is the
signal 13. The Signal 13 is a combination of two sine
waves with the frequency ratio of 1:1,3. This ratio
makes that the signal is very good for the test of
resonance. The signal also avoids the main problem of
the acoustic Rub&Buss measurement. It is the surrounding
noise that normally disturbs the measurement. For the
passed and failed decision there is the Q-index. The
Q-Index includes all distortion and noise of the
speaker.
For reporting and documentation the program writes a
protocol file.
Frequency response
The frequency response is tested
with the M-PN signal. The measurement with this periodic
noise gives the highest accuracy.
The tolerance mask can be set automatically or manually.
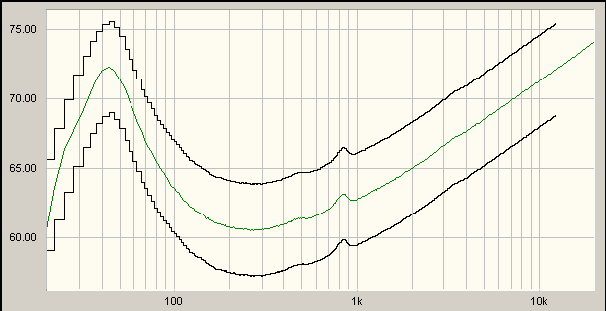
The picture shows the impedance test of a speaker for
the test of the Thiele-Small
parameter
The
picture shows the frequency response test of a speaker
For the definition of the
tolerance mask the frequency range and the upper and
lower tolerance curve is set in.
For the automatic setting the program calculates the
tolerance curves. This tolerance mask is for the
electrical measurement.
For the manual setting the tolerance curves are set with
the mouse click. This tolerance mask is for the acoustic
measurement.
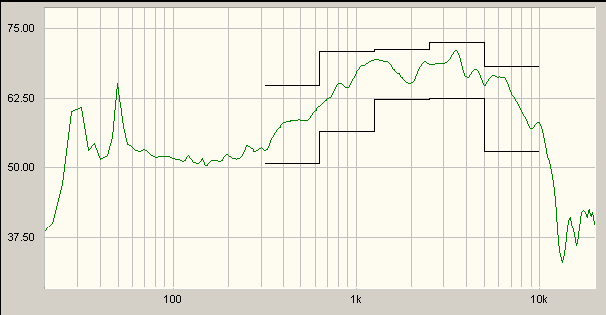
The Rub&Buss measurement
The Rub&Buss is tested with the
signal 13. The signal 13 consists of two sine-sweeps
with the frequency ratio of 1 : 1.3. This signal is
showing all resonances of the unit under test.
Electrical test of the signal 13
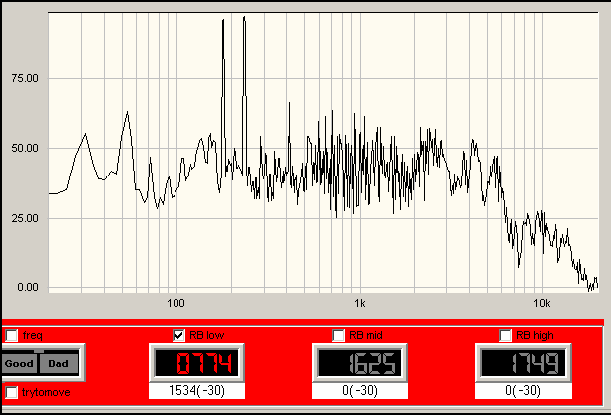
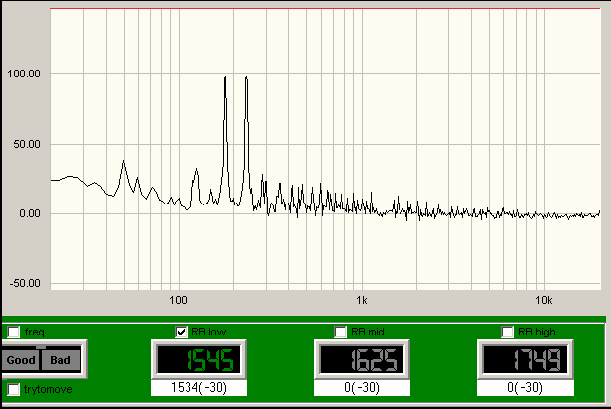
Test
of a broken speaker
For the passed and failed
decision the Q-Index is calculated. The index is
calculated from all frequencies higher than the second
frequency of the test signal 13. The account is set into
proportion to the amplitude of the test signal. The best
speaker has the highest Q-index.
The Rub&Buss measurement has
following tests.
|
Calculation of |
error |
| 1. THD,
K2…..K10 |
The test is
for the controlling of the placement of the
voice coil. |
| 2. IMD |
The test is
for the controlling the gluing, loose particle
and if there are cone touching of connection
wires. |
| 3.
Frequencies > K5 |
The test is
for the controlling of voice coil rubbing the
magnet. |
|